Unsupervised learning fits models without a target label for every example. The analyst still chooses the representation, objective, distance or similarity measure, algorithm, and validation criteria. Depending on those choices, a method may group observations, learn a lower-dimensional representation, estimate a density, or identify unusual observations. The result is therefore a model-dependent view of structure—not an objective discovery made “on its own.”
This guide provides practical examples and actionable insights to help you leverage the power of unsupervised learning algorithms, from customer segmentation to fraud detection.
What Is Unsupervised Learning and Why It Matters

Think of it like this: someone dumps a giant, mixed-up box of LEGO bricks in front of you without any instructions. Your natural instinct is to start sorting. You might group them by color, create piles of similar shapes, or separate them by size. That intuitive process of creating order from chaos is the very essence of unsupervised learning.
This stands in stark contrast to supervised learning, where you're given a picture of the finished LEGO castle to guide you. Unsupervised models work blind, exploring the data to reveal its natural structure. This makes them incredibly powerful for tackling problems where labels are either impossible to get, too expensive to create, or simply don't exist yet.
The Core Goal: Finding Structure in the Unknown
In practice, the important skill is not memorizing algorithms but matching the objective and assumptions to the data, then validating whether the result is stable and useful for the intended decision.
There are a few major families of unsupervised learning, each with its own specialty:
- Clustering: This groups observations under a chosen representation and distance measure. Candidate customer segments can inform differentiated messaging or offers, but uplift is not guaranteed. Validate segment stability, operational usefulness, fairness implications, and incremental impact through a controlled experiment before deployment.
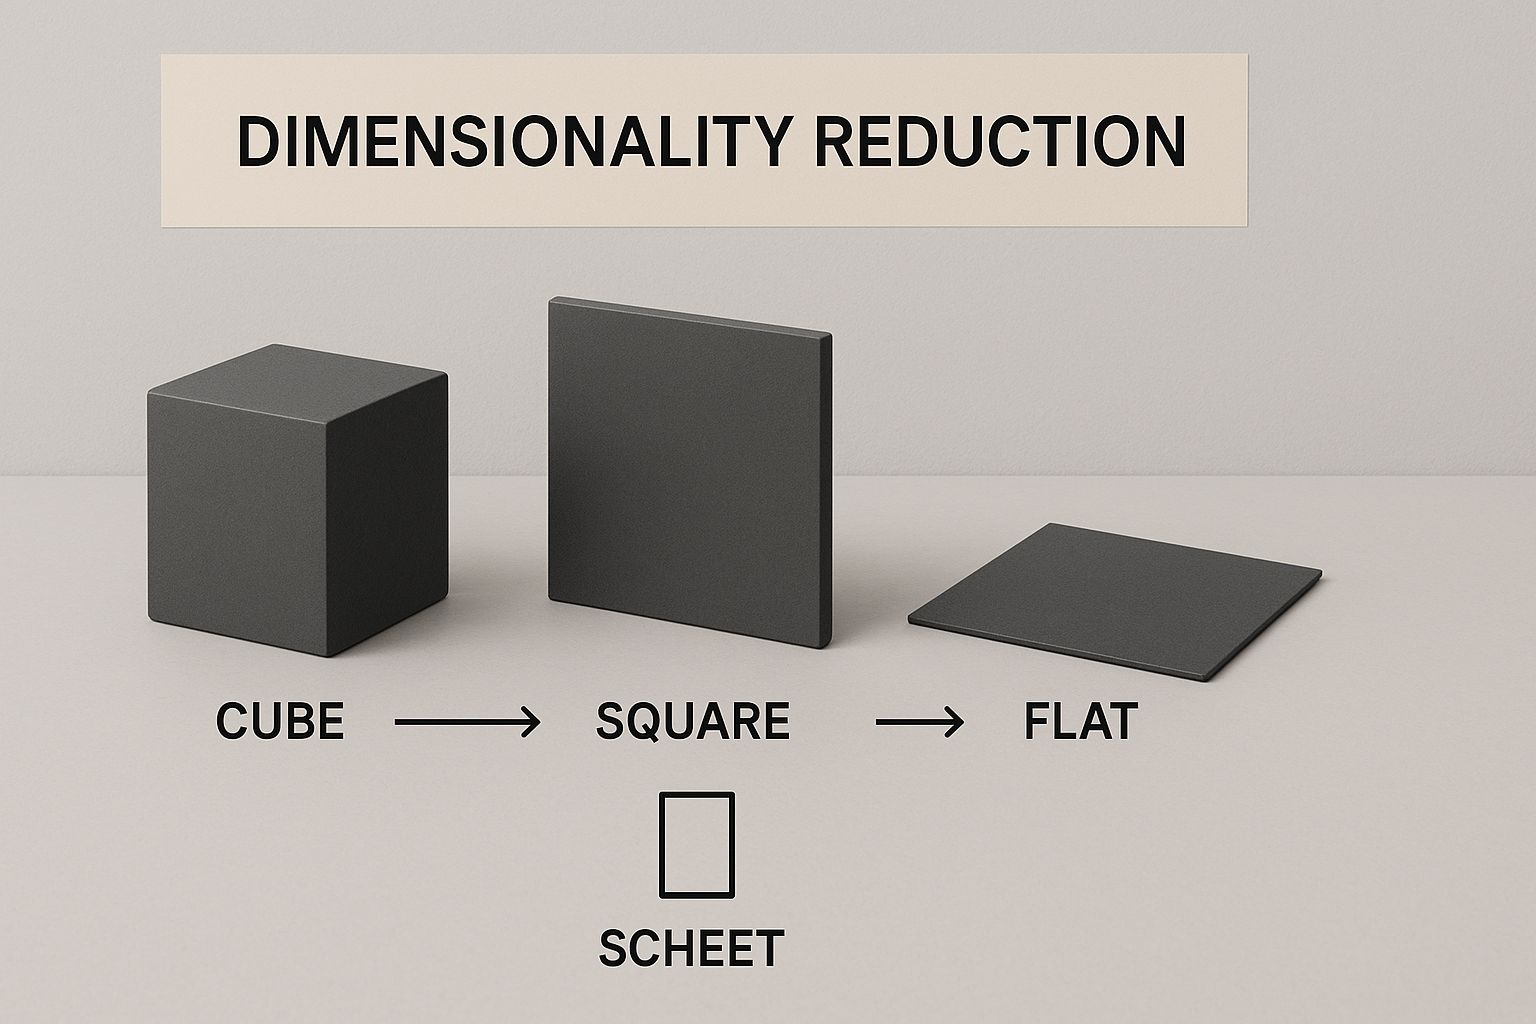
- Dimensionality Reduction: This technique simplifies massive datasets by boiling them down to their most important features. It’s like taking a dense, 100-page report and distilling it into a crisp one-page executive summary without losing the core message. Actionable Insight: This speeds up model training and can improve accuracy by removing irrelevant noise.
- Association Rule Mining: A standard application is market-basket analysis: estimating which items co-occur in transactions. Use a transparent example—such as laptops and mice—and report support, confidence, and lift from the actual dataset. Co-occurrence does not establish causation.
Unsupervised learning is critical for unlocking the promise of digital biology and scientific discovery. Algorithms that learn directly from unlabeled protein sequences can illuminate biology at a level not yet possible with experimental characterization alone.
This ability to find patterns without being told what to look for is no longer just a neat trick; it’s mission-critical for modern business. It’s how companies can truly understand customer behavior, spot sophisticated fraud, organize oceans of text, and find efficiencies they never knew existed.
Grouping Your Data with Clustering Algorithms
One of the most intuitive and powerful ways to use unsupervised learning is through clustering. At its core, the idea is incredibly simple yet profound: find the natural groupings hiding within your data without any predefined labels. It's about letting the data tell its own story by figuring out which data points belong together.
Clustering algorithms are the secret sauce behind countless business strategies, from pinpointing customer segments to flagging unusual activity. By grouping similar data points, you can tailor marketing messages, spot fraudulent transactions, or even organize massive document libraries automatically.
Let's break down two of the most popular and effective clustering techniques out there.
K-Means Clustering Unpacked
K-Means is a true workhorse in the world of clustering, loved for its speed and simplicity. The goal is to divide your data into a specific number of groups (K) that are distinct and don't overlap. The algorithm works by repeatedly assigning each data point to the cluster with the nearest mean, or centroid.
Think of it like setting up tables at a wedding reception. You decide you want to create five distinct groups of guests (K=5). You start by randomly placing one "table host" (initial centroid) at five different tables. Guests then find the host they feel the closest connection to and sit at that table.
Once everyone is seated, you find the new center of each group and move the "table host" sign to that spot. Guests might look around and realize they're now closer to a different host, so they move tables. This process repeats until no one moves, and the groups are stable. That's K-Means in a nutshell.
Practical Example: Customer Segmentation
Imagine you run an e-commerce store and want to get a better handle on who your customers are. You have data on two key metrics: purchase frequency and average order value. K-Means can slice this data into meaningful groups you can market to directly.
The algorithm might uncover three clear clusters:
- Bargain Hunters: These customers buy often but don't spend much per order. They have a high purchase frequency but a low average order value, likely waiting for sales.
- Loyal Enthusiasts: Your best customers. They shop frequently and have a high average order value, buying regularly and spending a lot.
- Occasional Big Spenders: These folks don't show up often, but when they do, they make it count. They have a low purchase frequency but a very high average order value.
This is a fantastic way to simplify a complex customer base into understandable personas. It's a bit like dimensionality reduction, another unsupervised technique that boils down complex data into its essential components. As we explored in our guide to dimensionality reduction techniques, simplifying data makes it more manageable and insightful.
Actionable insight: Treat these groups as hypotheses. Test whether differentiated messaging creates incremental value, and monitor opt-outs, fairness, segment drift, and operational cost.
Hierarchical Clustering Explained
While K-Means makes you decide on the number of clusters beforehand, Hierarchical Clustering offers a more flexible path. It builds a full hierarchy of clusters, either from the bottom up (agglomerative) or the top down (divisive), so you don't have to commit to a specific number of groups upfront.
The most common approach, agglomerative clustering, starts by treating every single data point as its own tiny cluster. From there, it systematically merges the two closest clusters, step by step, until only one giant cluster containing all the data is left.
Practical Example: Imagine you are an ecologist studying different plant species. You have measurements for petal length, sepal width, and other features. Hierarchical clustering could start by grouping individual plants, then merge them into species, then species into genera, and so on up the biological classification tree. The final output is a dendrogram—a tree-like diagram that beautifully visualizes this entire hierarchy.
This method is perfect for situations where you aren't sure how many clusters are hiding in your data. By looking at the dendrogram, you can decide on the best number of clusters after the algorithm has finished by simply "cutting" the tree at whatever height makes the most sense.
Strengths and Weaknesses to Consider
Picking the right algorithm is a critical step that depends on your specific goals and data. Every choice comes with trade-offs, much like the delicate dance between bias and variance when building any predictive model. If you want to dive deeper into that core concept, you can learn more about the bias-variance tradeoff in our detailed guide. It's a key principle that governs how well any machine learning model will perform on new, unseen data.
To help you decide, here’s a quick rundown of how K-Means and Hierarchical Clustering stack up against each other.
Comparing K-Means and Hierarchical Clustering
| Feature | K-Means Clustering | Hierarchical Clustering |
|---|---|---|
| Cluster Number (K) | Must be specified beforehand. | Not required; determined from the dendrogram. |
| Computational Speed | Very fast and efficient, scales well to large datasets. | Computationally intensive, especially for large datasets. |
| Geometry and linkage | Minimizes within-cluster squared Euclidean distance, so it is best suited to roughly isotropic groups; unequal variance, anisotropy, outliers, feature scale, and initialization can materially change the result. | Behavior depends on the distance metric, linkage rule, scaling, and any connectivity constraint. Single linkage can recover some non-convex structure but is noise-sensitive; Ward linkage favors compact variance-minimizing groups. |
| Output | A simple assignment of each point to a cluster. | An informative and interpretable dendrogram visualization. |
| Sensitivity | Can be sensitive to the initial placement of centroids. | Can be sensitive to noise and outliers in the data. |
Ultimately, K-Means is often the go-to for large datasets where you already have a good hunch about the number of groups you're looking for. On the other hand, Hierarchical Clustering gives you a richer, more detailed map of the relationships within your data, making it ideal for exploratory analysis when the underlying structure is a mystery.
Simplifying Complexity with Dimensionality Reduction
Modern datasets can feel like a sprawling, chaotic city map with thousands of roads and landmarks. Trying to find a clear path or just make sense of the layout is often overwhelming. This is exactly the challenge we face with high-dimensional data—datasets loaded with hundreds or even thousands of features.
This is where dimensionality reduction comes in. It’s one of the most powerful unsupervised learning algorithms for taming this kind of complexity.
Think of it as a master cartographer. It takes that ridiculously detailed map and creates a simpler, more elegant version that only highlights the most important routes. By intelligently combining or removing redundant features, it makes the data easier to visualize, faster to process, and less noisy, all without losing the core story the data is trying to tell. This isn't about blindly deleting information; it's a strategic summarization that preserves the essential structure.
Demystifying Principal Component Analysis
The most common technique for this is Principal Component Analysis (PCA). At its heart, PCA is a mathematical method that transforms your data into a new set of features, known as principal components. These new components are uncorrelated and ranked by how much of the original data's variance they explain.
Practical Example: Imagine you're analyzing a customer satisfaction survey with 100 different questions. You’ve asked about everything from product packaging and shipping speed to website usability and support agent helpfulness. Many of these questions are probably related. For instance, questions about "agent knowledge," "resolution time," and "friendliness" all really point to a single, broader concept.
PCA finds orthogonal linear combinations that successively explain variance in the chosen feature representation. It does not automatically assign semantic labels such as “product quality”; an analyst may interpret components only after inspecting their loadings and checking whether that interpretation is stable. Because PCA is scale-sensitive, standardize features when their units or variances are not directly comparable. Select the number of components using explained variance and downstream validation.
- Component 1: Overall Product Quality (capturing variance from questions about durability, design, features, etc.)
- Component 2: Customer Support Experience (capturing variance from questions about agent interactions, wait times, etc.)
PCA can reduce dimensionality and computation, but it does not guarantee higher predictive accuracy or less overfitting. Important low-variance signal may be discarded, so compare the complete preprocessing-and-model pipeline on held-out data.
Suddenly, instead of wrestling with 100 different variables, you’re working with just two. This makes it possible to create a simple 2D scatter plot to see customer sentiment at a glance, and it dramatically speeds up any machine learning models you build on top of this data. For a more technical look at this and other methods, our complete guide to dimensionality reduction techniques offers a deeper exploration.
Visualizing Data with t-SNE
While PCA excels at summarizing data for modeling, another technique called t-Distributed Stochastic Neighbor Embedding (t-SNE) is a true master of visualization. Its main purpose is to take high-dimensional data and create a stunning two or three-dimensional map that reveals its underlying cluster structure.
t-SNE works by modeling the similarity between data points. In the original high-dimensional space, it figures out the probability that two points are neighbors. Then, it tries to create a low-dimensional map where those neighborhood probabilities are as close as possible.
Practical Example: Mapping an Image Library
Let's say you have a massive, unlabeled library of 100,000 images. Each image is represented by thousands of pixel values, making it an incredibly high-dimensional dataset. You want to see if there are any natural groupings—maybe clusters of animals, landscapes, or portraits.
t-SNE is primarily an exploratory visualization method that tries to preserve local neighborhoods. Apparent cluster size, spacing, and shape can change with initialization and perplexity and do not necessarily carry global meaning. Run multiple seeds and perplexities, inspect the original-space neighbors, and do not treat separation in a t-SNE plot as proof of discrete classes.
- One dense cluster might contain all the images of dogs.
- Another cluster nearby could be all the cat photos.
- A separate region on the map might group together all the sunset landscapes.
Actionable Insight: This visualization gives you immediate, intuitive insight into your image library's structure without you ever having to label a single picture. It’s an incredibly powerful tool for exploratory data analysis, helping data scientists understand complex datasets at a glance and quickly identify potential data quality issues or interesting subgroups for further analysis.
Key Benefits of Dimensionality Reduction
Bringing these unsupervised learning algorithms into your workflow offers clear, tangible advantages that go far beyond just making pretty charts.
Here are the primary benefits:
- Faster Computation: Fewer dimensions mean less data for algorithms to chew on, which dramatically reduces training time and computational cost.
- Noise Reduction: By focusing on the components with the most variance, these methods often filter out irrelevant noise, leading to more robust models.
- Improved Visualization: They make it possible to plot and visually explore complex datasets that would otherwise be impossible to comprehend.
- Avoiding Overfitting: Simpler models with fewer features are less likely to overfit to the training data, improving their performance on new, unseen data.
Finding Hidden Patterns with Association Rules

While clustering is great for grouping customers, another family of unsupervised learning algorithms shines at grouping products. Welcome to the world of association rule mining, a technique designed to uncover interesting, and often surprising, relationships buried in large datasets.
Its most famous application is market basket analysis, which tackles a simple but incredibly valuable question: "What items do people frequently buy together?"
A commonly repeated “beer and diapers” story lacks reliable primary evidence for the specific placement-and-sales claim. A reproducible market-basket example should instead use a documented dataset and report the observed support, confidence, and lift.
This goes way beyond just identifying your best-selling items. The goal is to discover co-occurrence patterns and generate rules like, "If a customer buys product X, they are also likely to buy product Y."
The Apriori Algorithm in Action
One of the cornerstone algorithms for this task is Apriori. It works on a brilliantly simple principle: if an itemset is frequently purchased, then any subset of that itemset must also be frequently purchased. Put another way, if {bread, milk, butter} is a common trio, then {bread, milk} has to be a common pair.
The Apriori algorithm methodically sifts through transaction data, building up from individual items to pairs, then to trios, and so on. This step-by-step process lets it efficiently trim away unpopular combinations, focusing only on the patterns that actually matter.
The real magic of association rules is how they turn raw transaction logs into actionable business strategies. They bridge the gap between what customers buy and why, paving the way for data-driven decisions on product placement, promotions, and inventory.
Turning Insights into Actionable Strategy
Let's use a practical example. Say you run an online electronics store. By running the Apriori algorithm on your sales data, you might uncover a strong rule: "Customers who buy a new laptop often add a wireless mouse to the same order." This isn't just a neat piece of trivia; it's a strategic goldmine.
Actionable Insight: Armed with that one insight, you can make several high-impact changes:
- Smart Product Bundles: Create a "Work From Home Starter Kit" that bundles the laptop and mouse at a small discount.
- Targeted Cross-Selling: Program your checkout page to show a recommendation: "Setting up a new laptop? Don't forget a wireless mouse!"
- Optimized Warehouse Layout: Store laptops and wireless mice near each other in your warehouse to make picking and packing these common orders faster.
These are candidate interventions, not guaranteed outcomes. Evaluate them with controlled experiments and account for merchandising, operational, and customer-experience trade-offs. Association rules find observed pairings; anomaly-detection methods address a different objective.
Interpreting the Rules: Support, Confidence, and Lift
Finding the rules is just the first step. To make sure they're actually useful, we need to measure their strength using three key metrics.
- Support: This tells you how often an itemset shows up in your data. High support for {Laptop, Mouse} means this pair is purchased frequently, validating the rule's relevance.
- Confidence: This measures how often the rule holds true. If 80% of the time a laptop is bought, a mouse is also bought, the rule has a confidence of 0.8. It’s a measure of reliability.
- Lift: This is arguably the most important metric. Lift tells you how much more likely someone is to buy a mouse given that they've already put a laptop in their cart. A lift greater than 1 signals a strong, positive relationship that isn't just a random coincidence.
By filtering for rules with high support, confidence, and lift, you can cut through the noise and zero in on the hidden patterns that can genuinely move the needle for your business.
Real-World Applications of Unsupervised Learning
While the theory is interesting, the real magic of unsupervised learning happens when you apply it to actual business problems. These algorithms are far more than academic exercises; they’re the engines powering efficiency and fresh ideas in countless industries, turning messy, raw data into a genuine strategic advantage.
Across the board, from finance to manufacturing, companies are using these techniques to find insights that were hiding in plain sight. This ability is quickly becoming what separates the leaders from the laggards. Let's look at a few powerful, real-world examples.
Fraud and Anomaly Detection in Finance
The financial world is a torrent of transactions—millions every second. It's the perfect place for fraudsters to hide. Unsupervised learning, especially anomaly detection, acts as a crucial line of defense. These algorithms get to know the "normal" spending patterns for each customer, learning their typical transaction amounts, locations, and timing.
Practical Example: A customer who lives in New York and typically spends $50-$100 at a time suddenly has a $5,000 charge from a casino in Las Vegas at 3 AM. The anomaly detection system instantly flags this transaction as highly suspicious because it deviates significantly from the established "normal" behavior on multiple fronts (location, amount, time, and merchant type).
An anomaly score can route a transaction for an additional control such as step-up authentication, review, or a policy-based decline. An unusual transaction is not necessarily fraudulent, and an unsupervised detector does not by itself establish intent. Production fraud systems commonly combine rules, supervised signals, anomaly features, and investigation feedback, with thresholds selected against the cost of false positives and false negatives.
Hyper-Personalized Retail Experiences
Modern retail is all about making the customer feel understood. This is where clustering algorithms like K-Means shine by enabling deep customer segmentation. They sift through purchase histories, browsing habits, and demographic info to group customers into intuitive segments like "Bargain Hunters," "Brand Loyalists," or "Occasional Big Spenders."
With these segments defined, retailers can finally ditch the one-size-fits-all marketing approach. Instead of blasting everyone with the same email, they can craft campaigns that actually resonate.
- Bargain Hunters get pinged about sales and clearance events.
- Brand Loyalists receive early access to new products and exclusive rewards.
- Occasional Spenders are shown ads for high-value items that relate to their previous buys.
Personalization can also create privacy, fairness, and relevance risks. Measure incremental effect and user impact rather than assuming that a segment-driven campaign produces revenue or loyalty.
Predictive Maintenance in Manufacturing
On a factory floor, a single unexpected equipment failure can bring the entire production line to a screeching halt, costing a fortune in downtime and repairs. Unsupervised learning is flipping this reactive model on its head, making maintenance proactive.
Sensors embedded in machinery constantly stream data on temperature, vibration, and pressure. Anomaly detection algorithms analyze this data, learning the unique signature of a healthy, functioning machine.
Practical Example: A factory motor's vibration signature slowly starts to change over several weeks, even though it's still operating within normal temperature limits. An anomaly detection model, trained on months of healthy data, flags this subtle drift.
Actionable Insight: The system triggers an alert for the maintenance crew. They can inspect the motor during scheduled downtime, discovering a worn bearing and replacing it before it fails catastrophically. This planned, orderly repair prevents a costly, unscheduled shutdown.
Organizing Information with Topic Modeling
News outlets and content platforms are drowning in a constant flood of new articles, reports, and documents. Trying to organize this manually is a lost cause. Topic modeling algorithms, using techniques like Latent Dirichlet Allocation (LDA), can automatically scan text to figure out the main themes or topics inside.
This lets a media company instantly categorize thousands of incoming articles into sections like "Technology," "Politics," or "Sports," which makes it much easier for readers to find what they're looking for.
Putting Your First Unsupervised Algorithm to Work
Alright, enough theory. The real fun begins when you roll up your sleeves and put an algorithm to the test. Moving from concepts to code is where you’ll see the magic happen, but it’s not about just picking a random tool. The key is to have a clear goal in mind—are you trying to group things, simplify complexity, or find hidden patterns? Your answer will point you to the right algorithm.
Let’s imagine a real-world scenario. You’re managing customer support for a SaaS company and are drowning in thousands of support tickets. It’s impossible to read them all, but you know there are recurring themes. Your goal? To automatically find and categorize the most common issues. This is a perfect job for clustering.
A Practical Roadmap for Your Project
First things first, you need to get your hands dirty with data preparation. Raw text from support tickets is a mess of typos, jargon, and irrelevant words. You'll need to clean it up by removing common "stop words" (like "the," "is," and "a"), standardizing terms, and then converting the text into numbers the algorithm can actually work with—a process called vectorization.
This initial cleanup is arguably the most critical part of the whole process. If you want to go deeper on this, the Data4AI guide on data cleaning and preparation is a great place to start.
With your data prepped, you can now unleash a clustering algorithm like K-Means. Let's say you set K to 5. You're essentially telling the model, "Find the five most distinct groups of issues in this data." Once the model runs, you’ll examine the most common keywords in each cluster to give them a human-readable label.
You might end up with something like this:
- Cluster 1: "password," "reset," "login," "account" -> Login & Access Issues
- Cluster 2: "billing," "invoice," "charge," "refund" -> Payment Problems
- Cluster 3: "slow," "loading," "error," "crash" -> Performance Bugs
Actionable Insight: You didn’t tell the algorithm what to look for, but it found meaningful, actionable categories hidden within your raw data. Now you can:
- Route tickets automatically to the right support teams (e.g., billing issues go straight to the finance team).
- Identify the most frequent customer pain points and prioritize them for your product development roadmap.
- Create targeted FAQ pages or tutorials to address these common problems, reducing overall ticket volume.
Finally, how do you know if it worked? Success looks a little different here. Since there are no "right" answers to check against, you evaluate the results based on their usefulness. Do these clusters make sense from a business perspective? Are they distinct enough to help your team take action? If the answer is yes, then congratulations—your first unsupervised model is a success.
Common Questions About Unsupervised Learning
As you start working with unsupervised learning, a few key questions always pop up. Getting these sorted out helps clarify where these algorithms really shine and how they fit into your overall machine learning strategy.
The biggest point of confusion is usually the data itself. Supervised learning is like teaching with an answer key—you feed the model labeled data, like photos tagged as "cat" or "dog." In contrast, unsupervised learning algorithms are given a pile of unlabeled data and have to figure out the patterns on their own. It’s like giving them the same photos and asking them to group similar ones without ever telling them what a "cat" or "dog" is.
How Do You Know if It’s Working?
So, if there are no "right" answers, how can you tell if an unsupervised model is any good? Evaluation is a bit different here.
Evaluate clustering from several angles. Internal indices such as the silhouette coefficient summarize cohesion and separation under a chosen distance metric, but they are not ground truth. Also test stability across resamples and random seeds, inspect sensitivity to scaling and hyperparameters, use external labels only when independently available, and run a downstream experiment when a business intervention is proposed.
Ultimately, the real test is whether the model gives you useful, actionable insights. A technically perfect model that doesn't help you solve a business problem is just a clever failure.
Can You Mix Unsupervised and Supervised Learning?
Absolutely, and it's a very powerful technique. Think about it this way: you could use a clustering algorithm to segment your customers into natural groups first.
Once you have those segments, you can then build a separate supervised model for each one to predict something specific, like customer churn. This hybrid approach often creates far more accurate and nuanced models than using either method alone. Understanding how to combine these strategies is a big deal in many data roles, and you can get a feel for the concepts by reviewing common master data management job interview questions.
Primary references
- Scikit-learn: demonstration of K-means assumptions
- Scikit-learn: importance of feature scaling
- Scikit-learn: effect of perplexity in t-SNE
- Scikit-learn: silhouette analysis
Fact-check record
Reviewed September 4, 2026. Corrected the conceptual definition, clustering comparison, PCA and t-SNE limitations, association-rule folklore, anomaly-detection claims, evaluation advice, and unsupported market statistics. Outcomes are now presented as hypotheses requiring validation rather than guaranteed business results.

Historical comments from Datanizant
No public comments on this article
1 imported entry withheld from public display after manual spam and duplicate review. The source archive remains unchanged.